Monitoring, Observability & Incident Response for Copilot Studio Agents in Production
Introduction
A Copilot Studio agent goes live. Users start talking to it. Three weeks later, someone in leadership asks, "Is it actually working?"
If your answer is "I think so," you don't have observability — you have hope.
Production AI agents need the same monitoring rigour as any critical business system: telemetry, KPIs, anomaly alerts, and a runbook for when things go wrong. This article gives you all four.
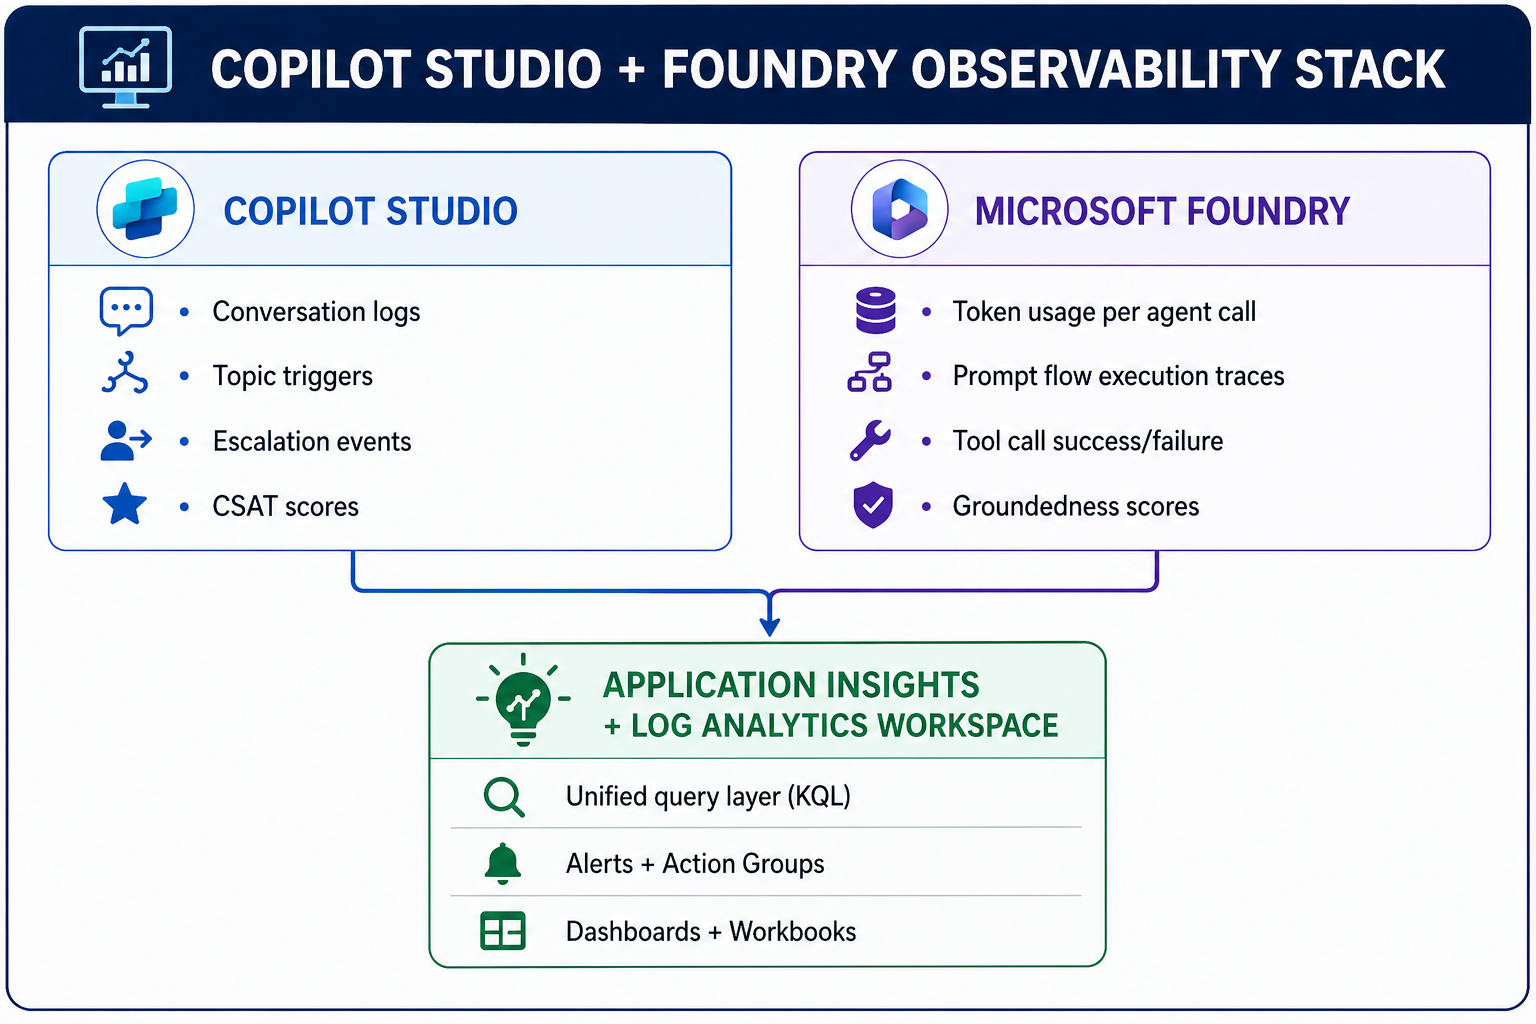
Step 1: Connect Copilot Studio to Application Insights
This is the first thing you do before going live. Without it, conversation data lives only in Copilot Studio's limited built-in analytics — no custom queries, no alerts, no retention control.
# Connect Copilot Studio environment to Application Insights
# Run once per environment during provisioning

Set-AdminPowerAppEnvironmentApplicationInsights `
    -EnvironmentName "prod-environment-id" `
    -InstrumentationKey ""

# Verify connection
Get-AdminPowerAppEnvironmentApplicationInsights `
    -EnvironmentName "prod-environment-id"
Once connected, every conversation event flows into Application Insights as a custom event you can query with KQL.
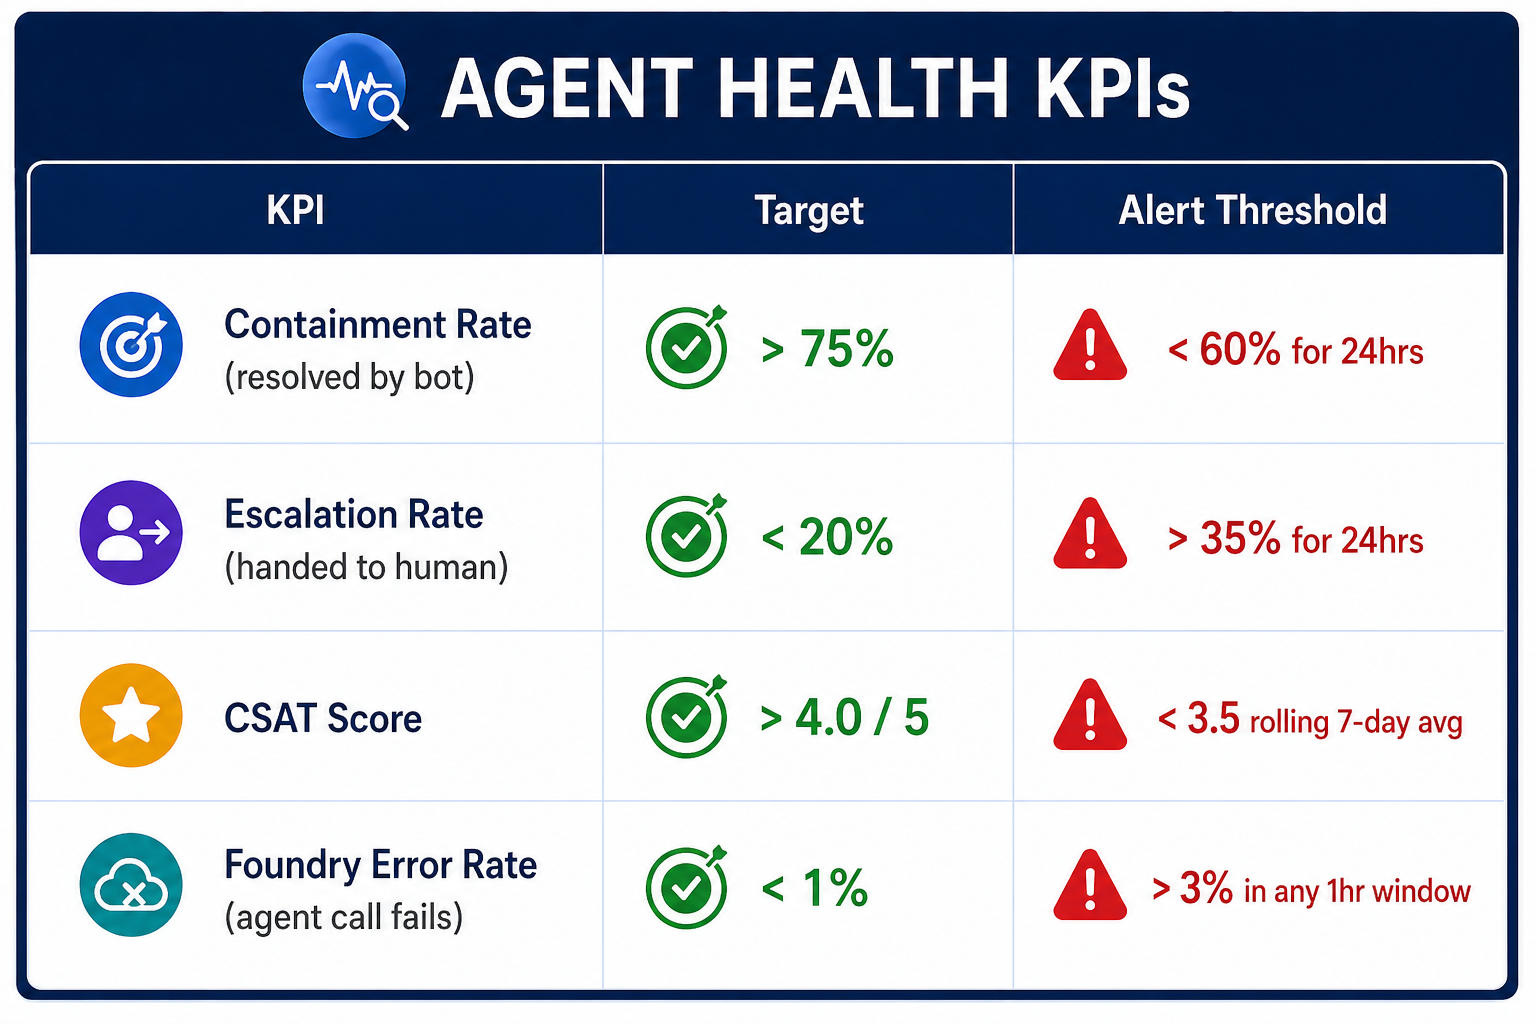
Step 2: The 4 KPIs That Define Agent Health
Track these. Nothing else matters until these are green.
KQL queries for each KPI:
// KPI 1: Containment Rate (last 7 days)
customEvents
| where timestamp > ago(7d)
| where name in ("ConversationEnd", "EscalationTriggered")
| summarize
    Total = countif(name == "ConversationEnd"),
    Escalated = countif(name == "EscalationTriggered")
    by bin(timestamp, 1d)
| extend ContainmentRate = round((1.0 - (todouble(Escalated) / Total)) * 100, 1)
| project timestamp, ContainmentRate, Total, Escalated
| order by timestamp desc

// KPI 2: Foundry Agent Error Rate (last 1 hour)
customEvents
| where timestamp > ago(1h)
| where name == "FoundryAgentCall"
| summarize
    Total = count(),
    Errors = countif(tostring(customDimensions.status) == "error")
| extend ErrorRate = round((todouble(Errors) / Total) * 100, 2)
| project Total, Errors, ErrorRate

// KPI 3: CSAT rolling 7-day average
customEvents
| where timestamp > ago(7d)
| where name == "ConversationRating"
| extend Rating = todouble(customDimensions.rating)
| summarize AvgCSAT = round(avg(Rating), 2)
Step 3: Custom Telemetry from Microsoft Foundry
Copilot Studio events tell you about the conversation. Foundry telemetry tells you about the AI. You need both.
# foundry_telemetry.py
# Emit structured telemetry on every Foundry agent execution

from opencensus.ext.azure import metrics_exporter
from applicationinsights import TelemetryClient
import time

tc = TelemetryClient("")

def invoke_agent_with_telemetry(agent, user_message: str, session_id: str) -> dict:
    start = time.time()
    error = None

    try:
        response = agent.invoke({"message": user_message, "session_id": session_id})

        # Track success with full context
        tc.track_event("FoundryAgentCall", properties={
            "sessionId": session_id,
            "agentName": agent.name,
            "status": "success",
            "topicClassification": response.get("topic"),
        }, measurements={
            "inputTokens": response.get("usage", {}).get("input_tokens", 0),
            "outputTokens": response.get("usage", {}).get("output_tokens", 0),
            "groundednessScore": response.get("groundedness_score", 0),
            "latencyMs": (time.time() - start) * 1000
        })

        return response

    except Exception as e:
        error = str(e)
        tc.track_event("FoundryAgentCall", properties={
            "sessionId": session_id,
            "agentName": agent.name,
            "status": "error",
            "errorMessage": error
        })
        tc.track_exception()
        raise

    finally:
        tc.flush()
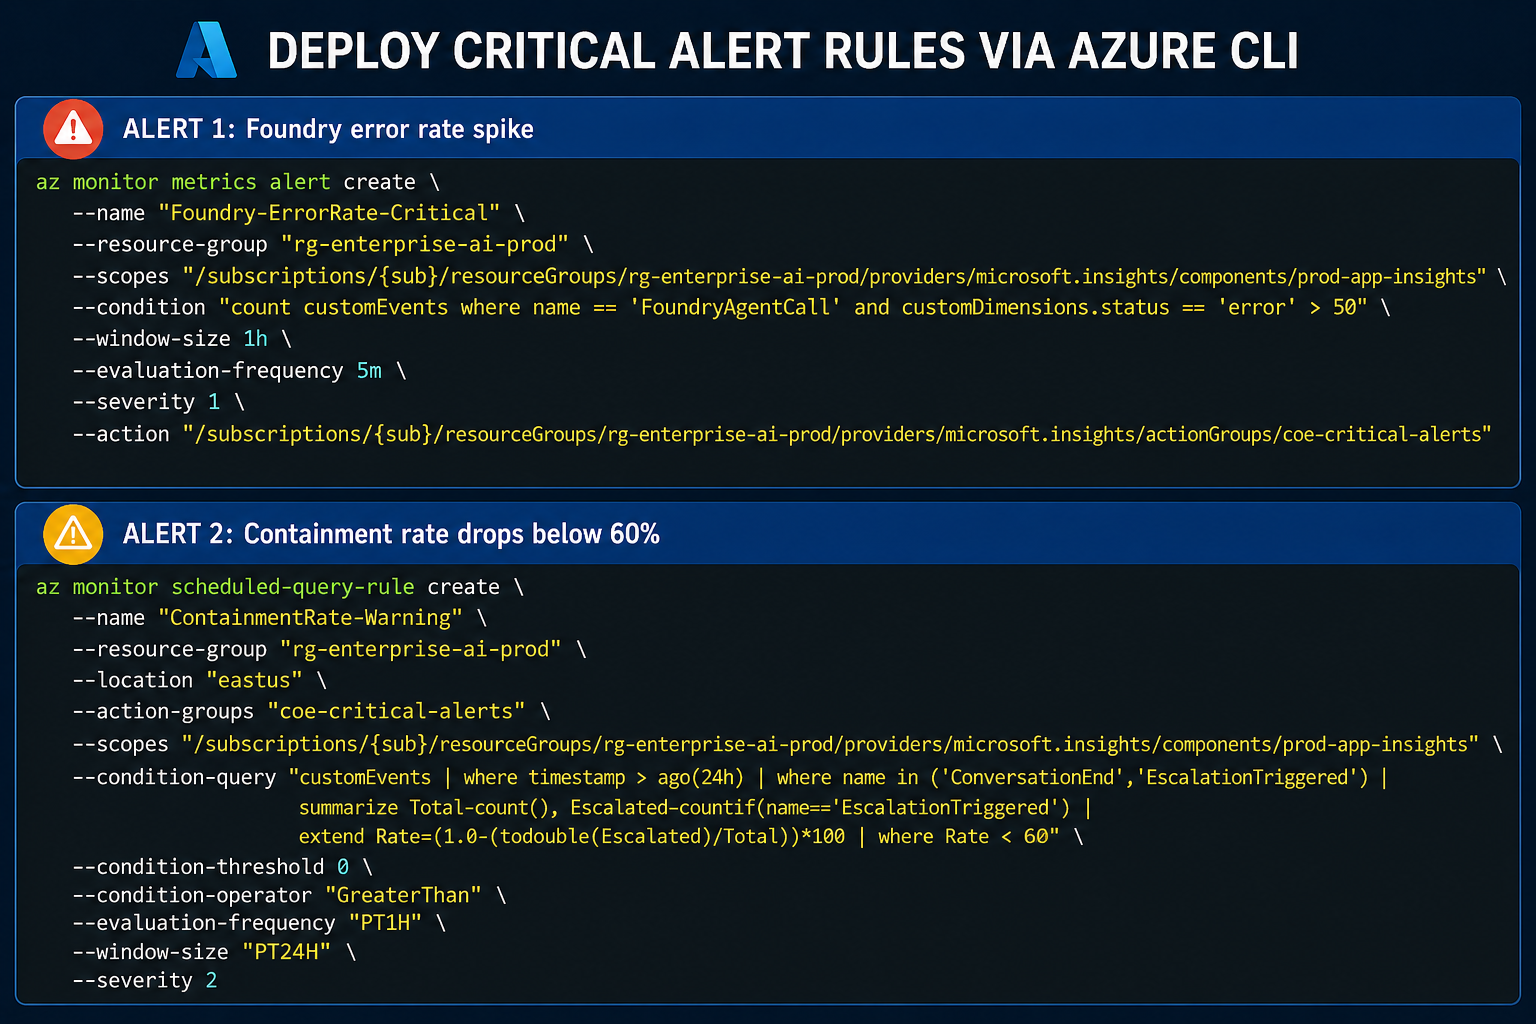
Step 4: Alert Rules That Matter
Don't create 20 alerts nobody reads. These three are the ones that demand immediate action:
Step 5: Incident Response Runbook
When an alert fires, this is the playbook.
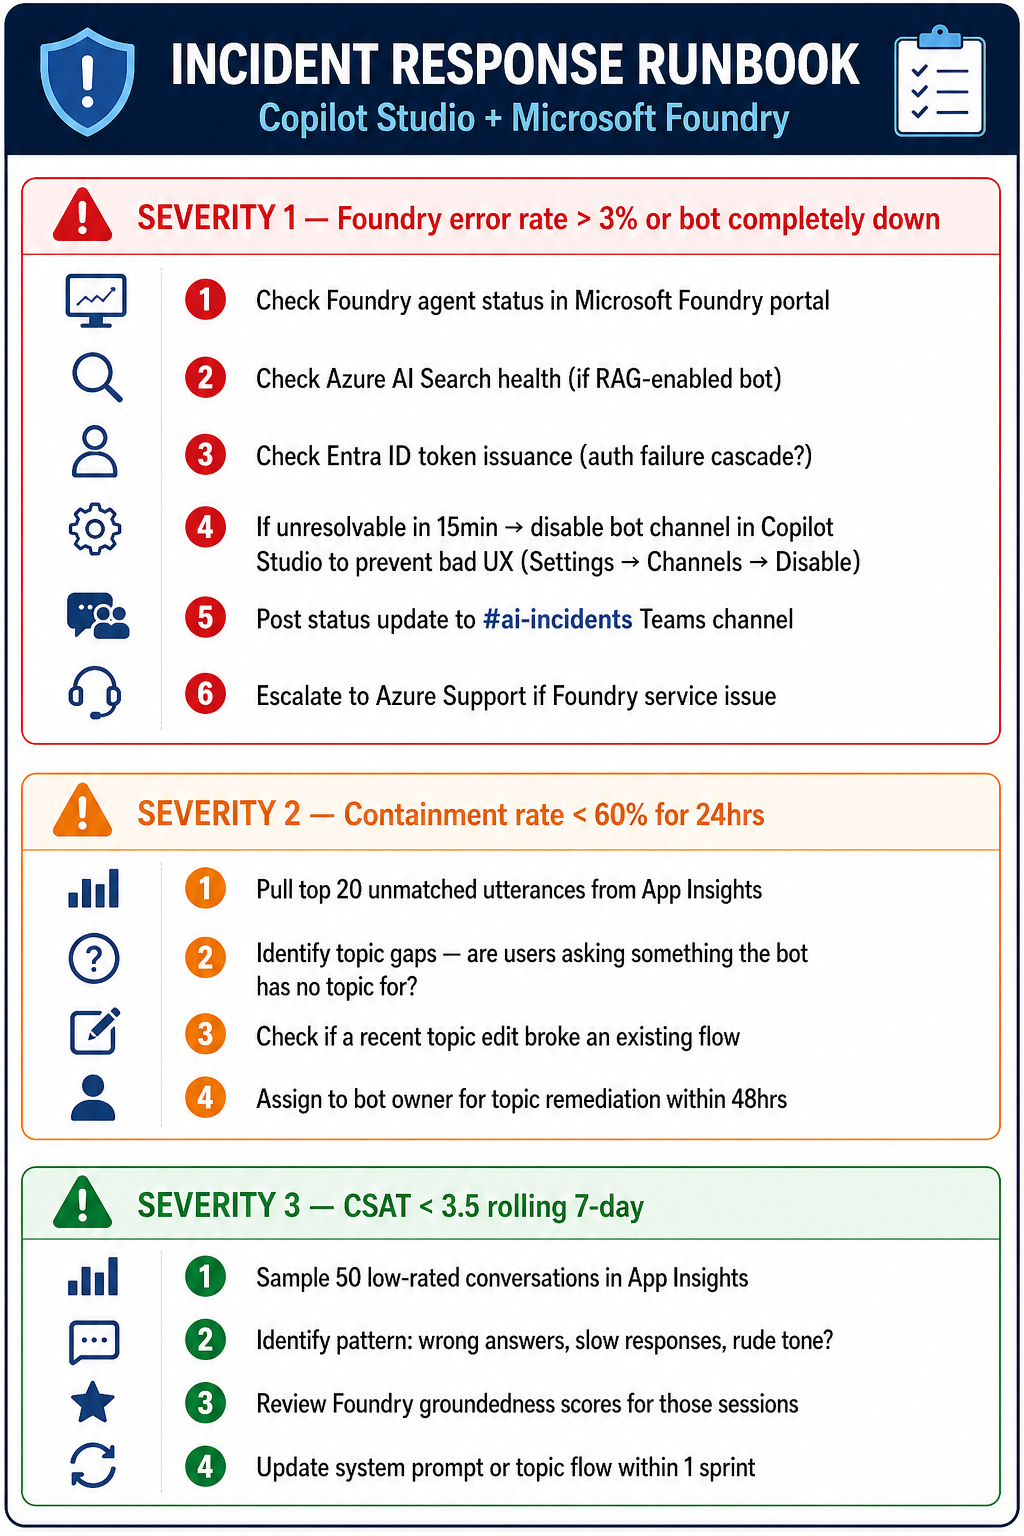
KQL query to surface unmatched utterances for Severity 2:
// Top unmatched utterances — find topic gaps fast
customEvents
| where timestamp > ago(24h)
| where name == "UnrecognizedInput"
| extend utterance = tostring(customDimensions.userMessage)
| summarize Count = count() by utterance
| order by Count desc
| take 20
Key Takeaways
- Connect App Insights before go-live—not after the first incident.
- Four KPIs only—Containment, Escalation, CSAT, and Foundry Error Rate. Everything else is noise until these are stable.
- Emit Foundry telemetry explicitly — it doesn't happen automatically; you must instrument it.
- Three alert rules — error spike, containment drop, CSAT floor. Enough signal, no noise.
- A runbook is not optional — when an alert fires at 2am, nobody should be figuring out what to do for the first time.