Take a Deep Dive: Azure Application Insights

Understanding real-time information from your live web apps is critical for providing a great client experience. In today's fast-paced development environment, frequent upgrades and deployments are usual, but they can occasionally cause performance or functionality concerns.
To avoid any negative impact on your users, you must discover and fix these issues proactively, ideally as soon as they arise. Azure Application Insights offers a simple method for attaining this degree of proactive monitoring and issue resolution across all of your web applications and services.
In this blog article, we will provide you a full overview of Application Insights and its key features. In addition, we will look at how to successfully monitor real-world concerns within our online apps. Becoming an expert in Azure application management also helps you pass the AZ-900 Certification with flying colors.
What is Azure Application Insights?
Azure Application Insights is an Application Performance Management (APM) solution that helps web developers achieve interoperability across several platforms. Its major duty is to monitor active web applications for performance issues.
With its powers and features, Application Insights provides data analysis tools that are critical in determining the fundamental causes of application difficulties. This allows for a more thorough understanding of user interactions inside your app, as well as the identification of areas for improvement that will lead to enhanced performance and user experience.
Furthermore, it broadens its reach to other platforms, ranging from on-premises and off-premises to cloud environments. It also integrates effortlessly with your internal DevOps protocols, solidifying its status as a useful asset throughout the development lifecycle.
How do Application Insights Work?
You can improve your application's monitoring capabilities by adding a tiny instrumentation package (SDK) or updating the Application Insights configuration, as relevant. This instrumentation actively monitors your application's behavior and sends the collected data to an Azure Application Insights Resource via a unique GUID called an Instrumentation Key.
This instrumentation is not restricted to web service applications; it can also monitor background processes and JavaScript running on your webpages. Importantly, your application does not have to be hosted solely on Azure; it can run elsewhere.
Furthermore, you can collect metrics from a variety of sources within the host environment, including performance counters, Azure diagnostics, and Docker logs. You may even set up web tests to send simulated queries to your web service on a regular basis for testing.
All of these data sources are combined and made available through Azure Monitor. The Azure portal provides you with powerful analytical and search tools for successfully analyzing and exploring raw data.
Use cases of Azure Application Insights
Some use cases of Azure Application Insights may include:
• Identify and troubleshoot problems and issues that are hurting the operation of your application.
• Use sophisticated query capabilities to improve your application's efficiency and usefulness.
• Recognize growing trends in how your application acts, identify usage patterns, and respond quickly to key questions about your website's performance.
• Easily manage Azure websites, container-hosted applications, on-premises configurations, and those hosted by other cloud providers.
• Integrate seamlessly with your DevOps workflow utilizing tools such as Visual Studio Team Services (VSTS), GitHub, and webhooks.
• Monitor existing apps without having to redeploy them, or start monitoring immediately from Visual Studio.
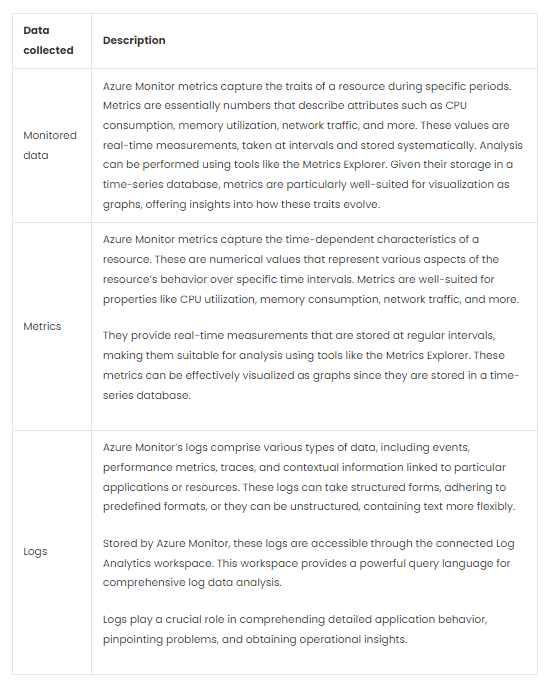
What is Azure Monitor?
The Azure Monitor tool collects and analyzes data on Azure resources and the infrastructure on which they run. It means you'll be able to save and analyze data about different resources.
Azure resources aggregate metrics and logs, which are then translated into alerts, troubleshooting problems, and dashboards to provide great visibility of Azure and the ways used to defend against those difficulties.
The Azure monitor's capabilities include a highly interactive query language and ML capabilities, as well as the ability to link with technologies such as DevOps and security data.
Need of Monitoring
Monitoring is required in any application and has an impact on its performance. However, relying on monitoring methods can lead to beneficial outcomes in the end. To accomplish this, we must examine designs such as microservices centered on multiple apps and collaborate on observations made throughout the application lifecycle, from development to release.
What do Application Insights Monitor?
Application Insights helps you assess your app's performance and usage by gathering the following information:
• Find popular pages, user locations, and peak usage periods.
• Assess the efficiency of the request-response procedures.
• Monitor external services and servers that may slow down operations.
• Analyze data statistics, identify specific cases, and collect process information.
• Monitor page views and app loading performance.
• Track conversion rates, response time, click rates, downloads, and AJAX call failures.
• Gain insight into user logins and session lengths.
• Investigate the performance of Azure Docker-hosted web hosts.
• Access the diagnostic event logs from your application.
• Create customized events and metrics to track business-specific events.
How does Azure Monitor work?
Azure Monitor collects data from several sources, including Azure resources, apps, and operating systems. The collected data is entirely dependent on the resource type and can be log data, metric data, or both. It can be utilized for visualization, analysis, automation, and alarms.
How to install Azure Application Insights?
Follow these steps to set up Azure Application Insights:
• Ensure that your system includes Visual Studio 3 or a more recent version, as well as an active Microsoft subscription.
• To start the procedure, right-click on your App's Solution Explorer and select "Add > Application Insights Telemetry…" or "Configure Application Insights."
• Select your Microsoft account subscription, pick Azure resources, and complete the Azure Application Insights registration.
• Start the application by pressing F5, and then start observing the telemetry.
• Create a specialized dashboard for your monitoring team, giving them a single platform to track all telemetry performance using Application Insights.
Data collected by Azure Application insights on web applications:
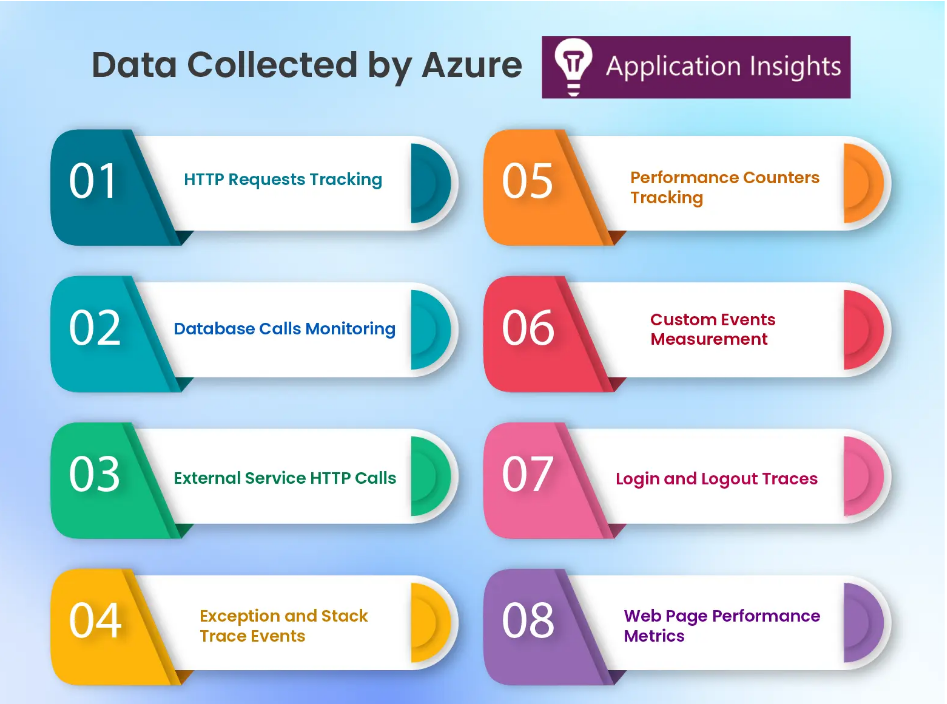
• HTTP Requests Tracking
• Database Calls Monitoring
• External Service HTTP Calls
• Exception and Stack Trace Events
• Performance Counters Tracking
• Custom Events Measurement
• Login and Logout Traces
• Web Page Performance Metrics