CONFIGURING NEAR REAL-TIME METRIC ALERTS – STEP BY STEP DEMO

In this demo, we are going to create a Linux Virtual Machine in Azure using the Cloud Shell and then we will test near real-time metric alerts. Sometime ago, one of my friends who was learning Azure had a question regarding how to monitor near real time metrics and get the alerts. I suggested him some quick tips and designed this demo for him. I am sure this is going to be helpful to you as well if you don’t know how to work with Azure Metric Alerts.
Basically, we will first create a Linux Virtual Machine using the cloud shell and then we will connect to it using SSH. Then we will define metric alerts and actions to monitor the activity.
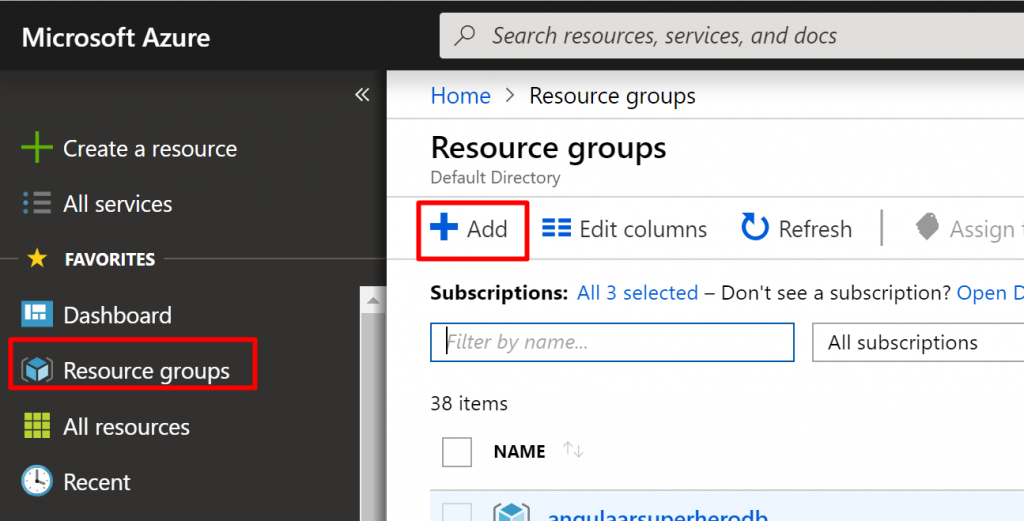
Step 1) Login to the Azure Portal. Go to Resource Groups and click on Add to add a new resource group.
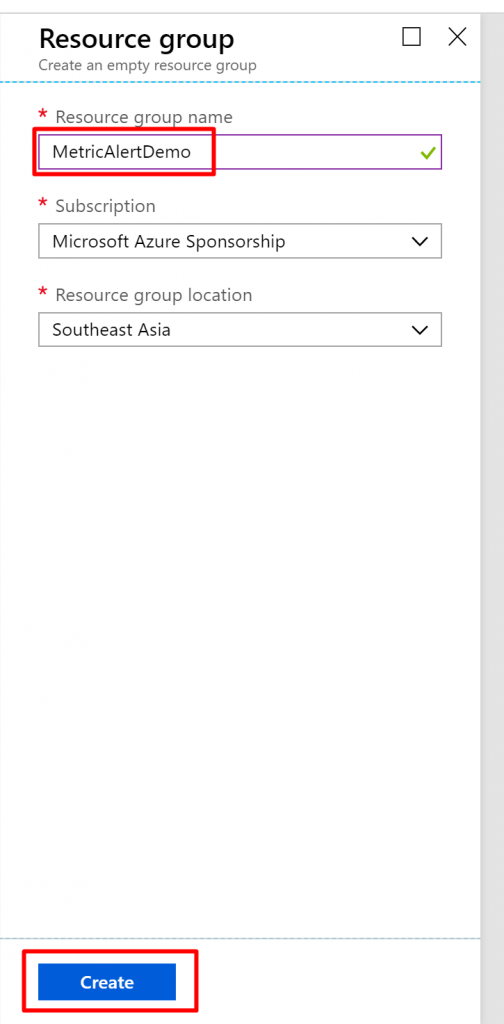
Step 2) Give name MetricAlertDemo to the resource group, select an appropriate subscription and resource group location. Click on Create.
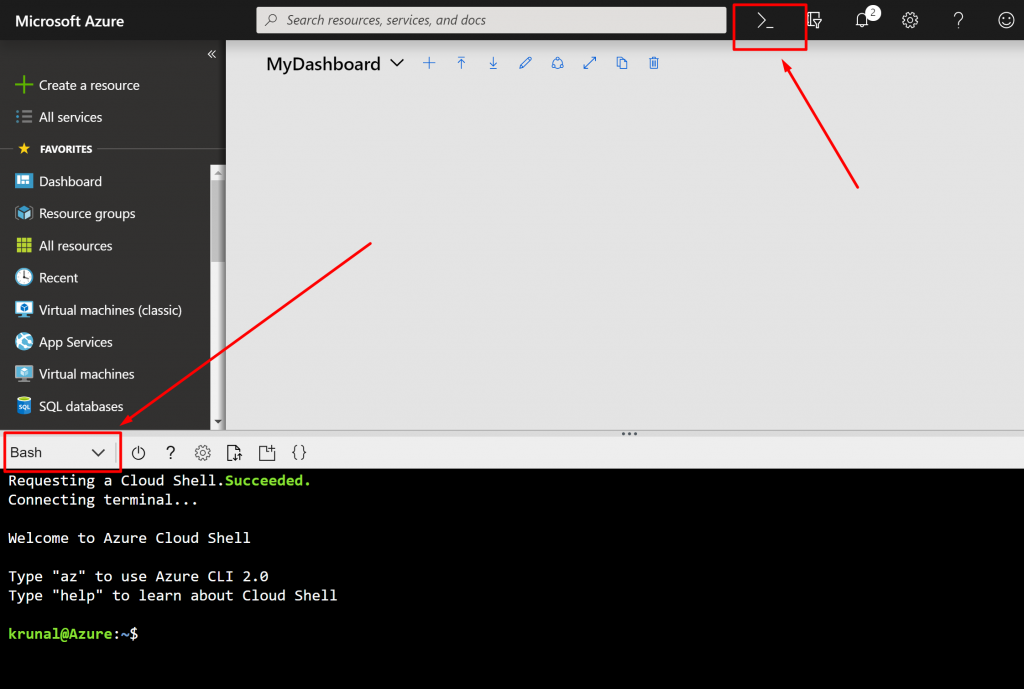
Step 3) Click on ‘>_’ icon to connect to the Cloud Shell. Switch to Bash.
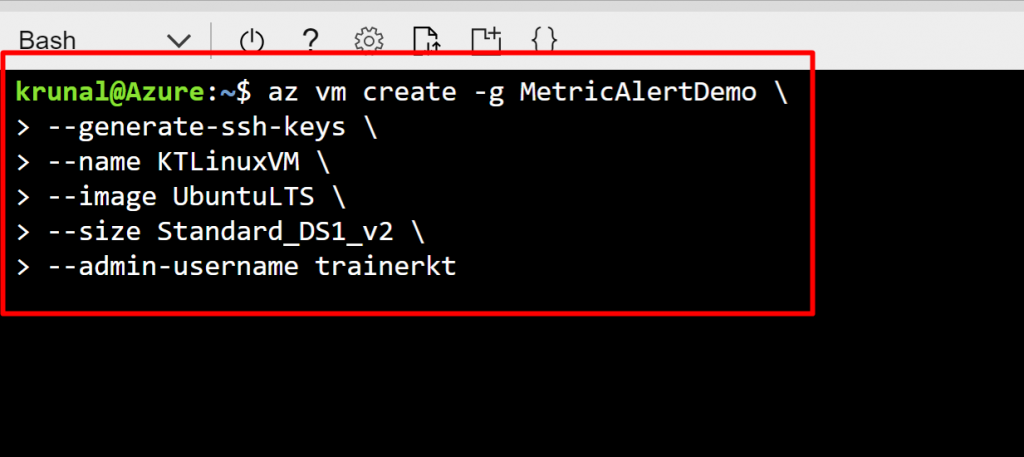
Step 4) Run the following command to create a VM. This will create a VM with the name KTLinuxVM in the resource group MetricAlertDemo of the image UbuntuLTS and of size Standard DS1_v2. It will also generate SSH Keys so that you can connect to the VM using SSH. The last parameter is the admin username which trainerkt.
az vm create -g MetricAlertDemo --generate-ssh-keys --name KTLinuxVM --image UbuntuLTS --size Standard_DS1_v2 --admin-username trainerkt
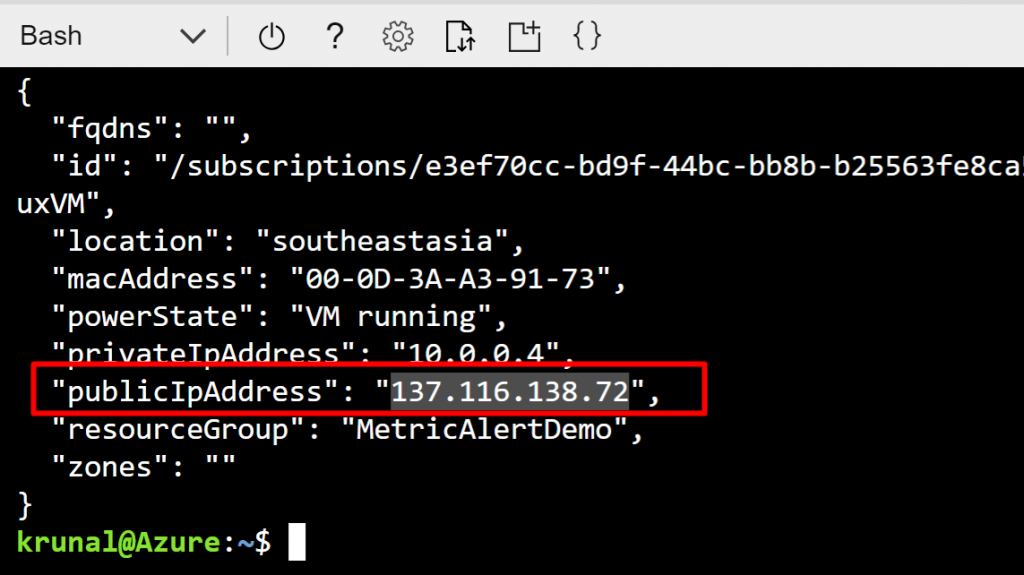
Step 5) Note down the Public IP Address of the VM that gets created.
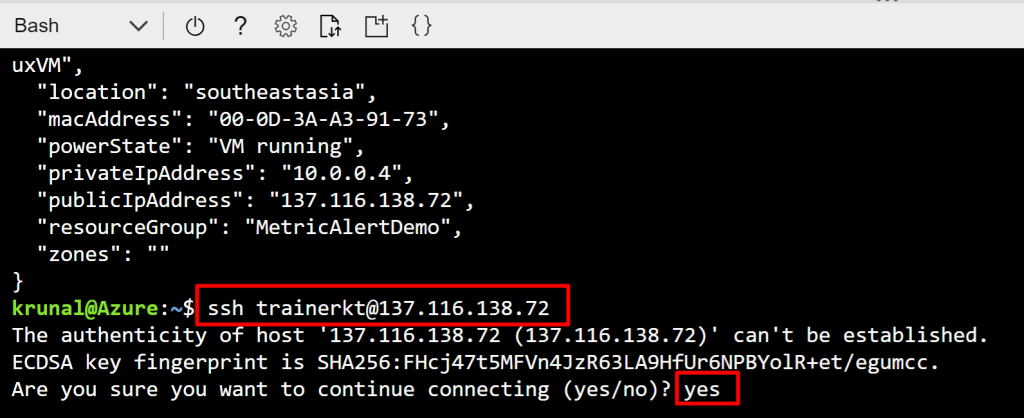
Step 6) Run the following command. When prompted, type yes.
ssh YourAdminUsername@
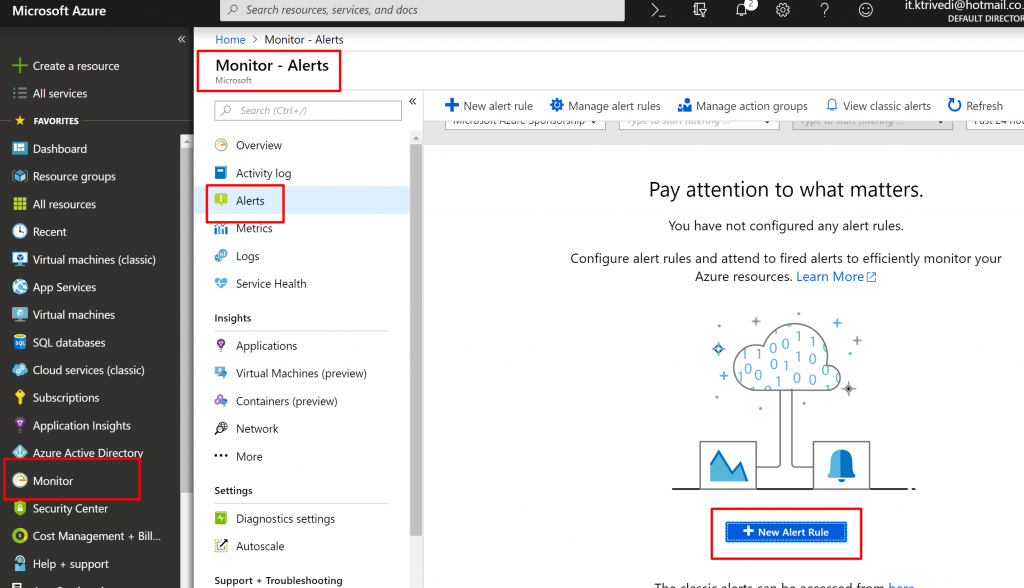
Step 7) Now, go to the Monitor tab and go to Alerts. Click on New Alert Rule to create a new alert rule.
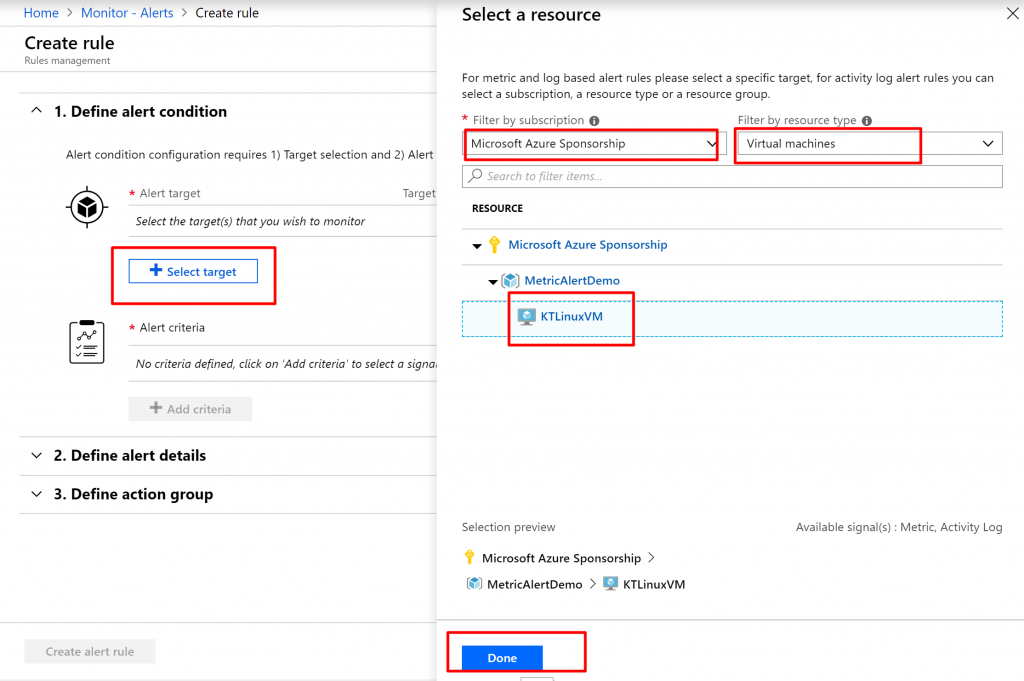
Step 8) Click on Select Target. It will open up a new blade. Find your VM that you just created and select that. Click on Done.
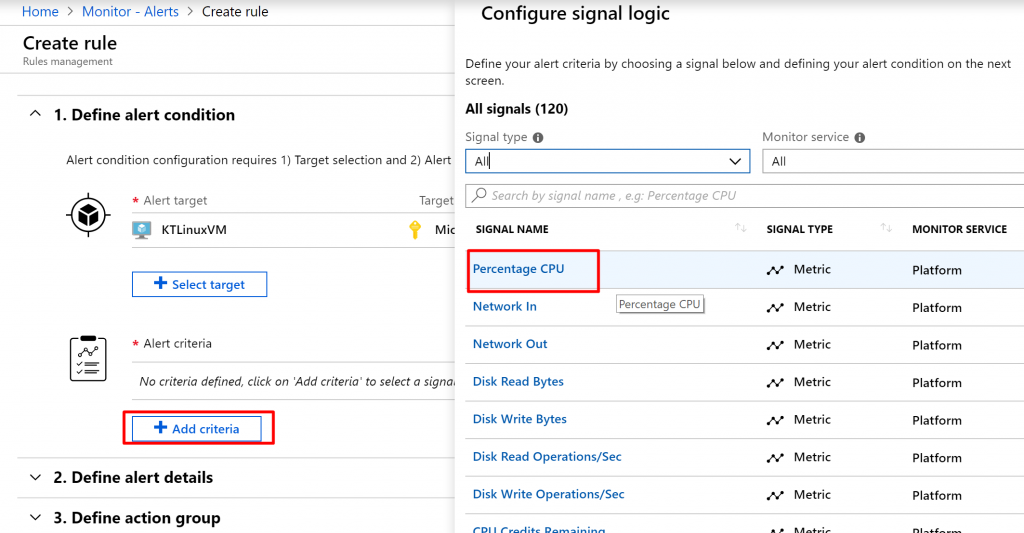
Step 9) Then, click on Add Criteria to define a new criteria. Select Percentage CPU from the list of Signal Names.
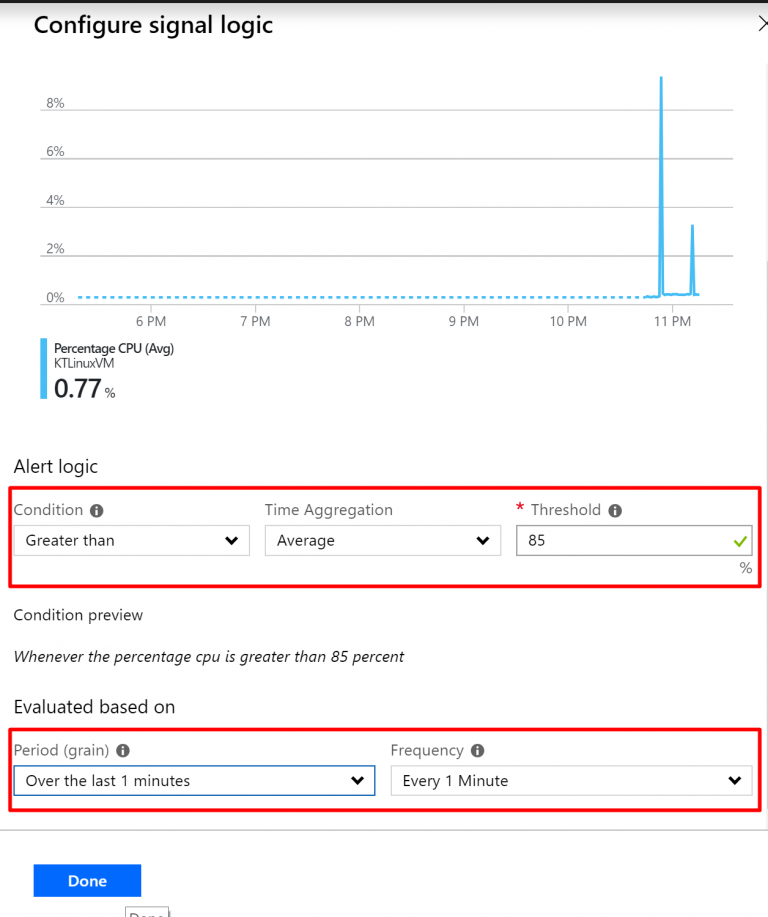
Step 10) In the condition, select Greater than. Select Average time aggregation and keep the threshold as 85%. Keep the period as Over the last 1 minutes and keep the frequency as 1 minutes. This means that it will generate an alert every time the CPU threshold goes above 85%.
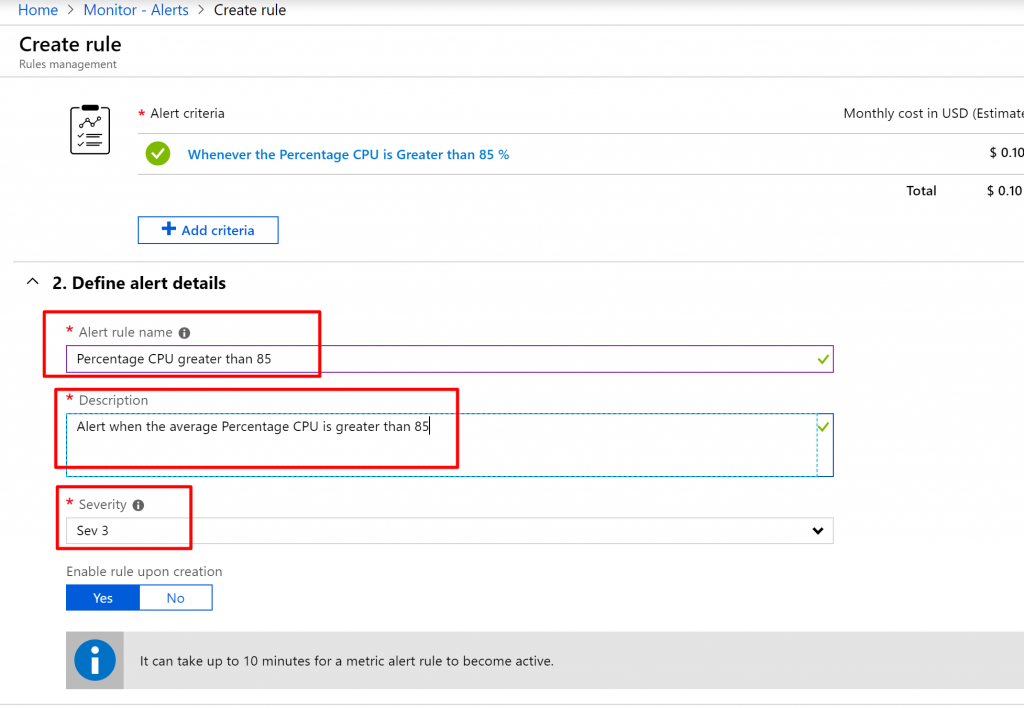
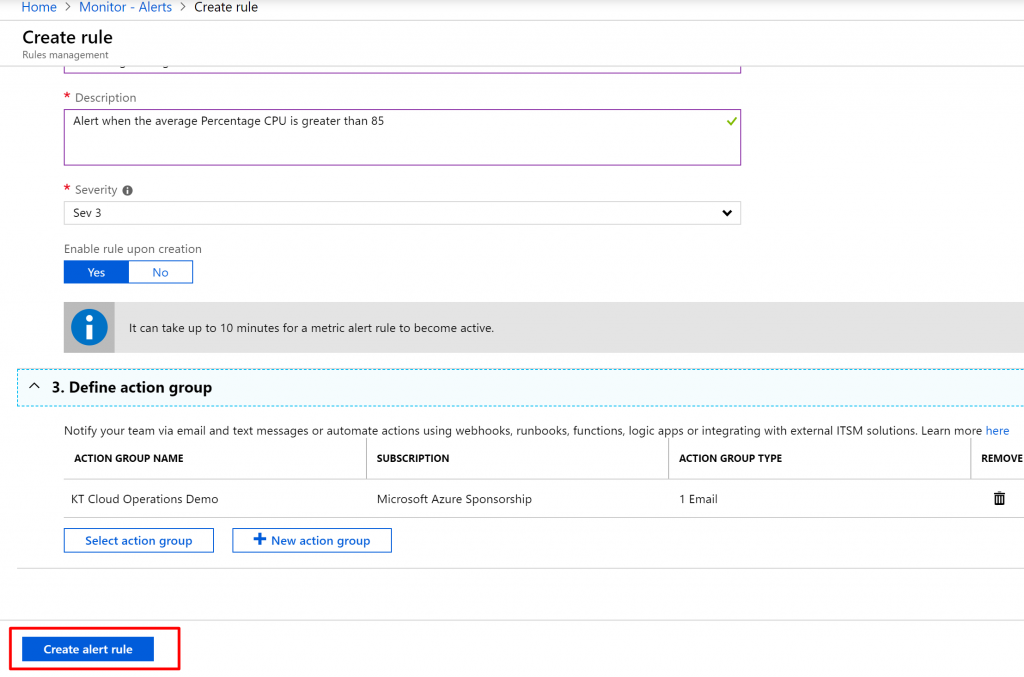
Step 11) In the alert details, give the alert rule name as shown below and give it logical description. Keep the severity as Sev 3.
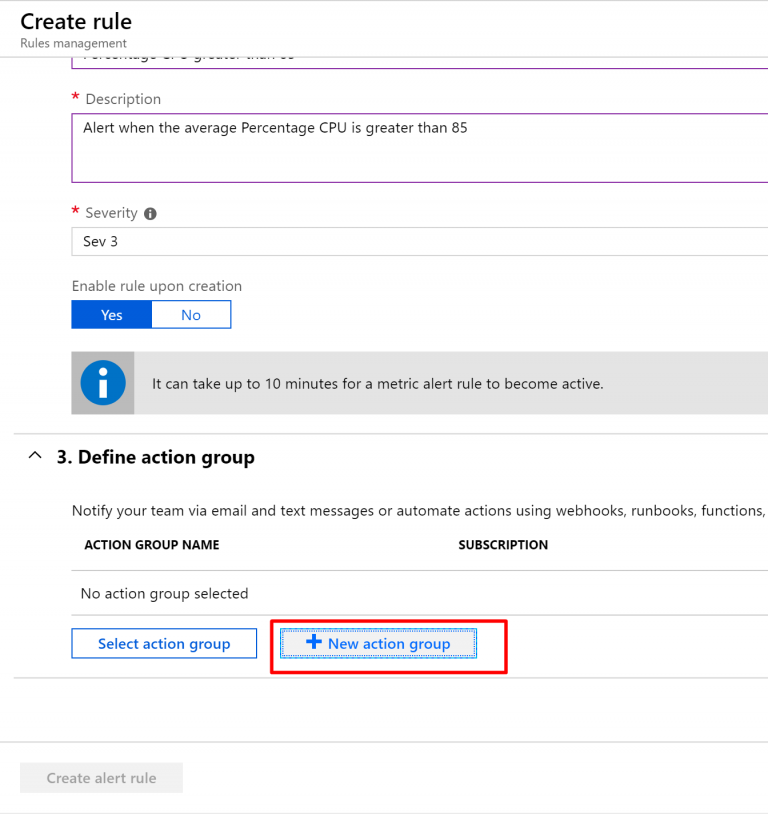
Step 12) Scroll down in the action group section and click on New Action Group to create a new one.
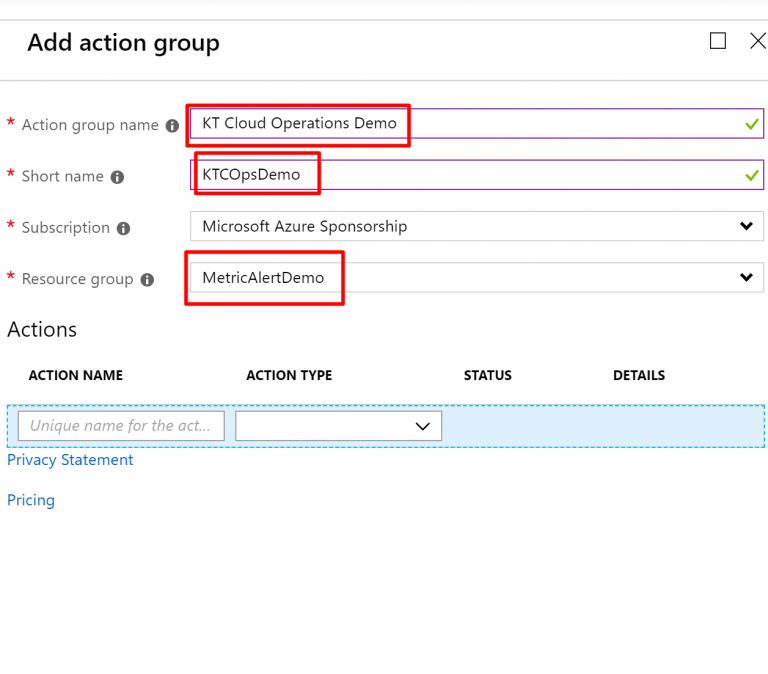
Step 13) Give the action group a name and also give it a short name. Keep the subscription same as the resource group that you have created and select the same resource group as well.
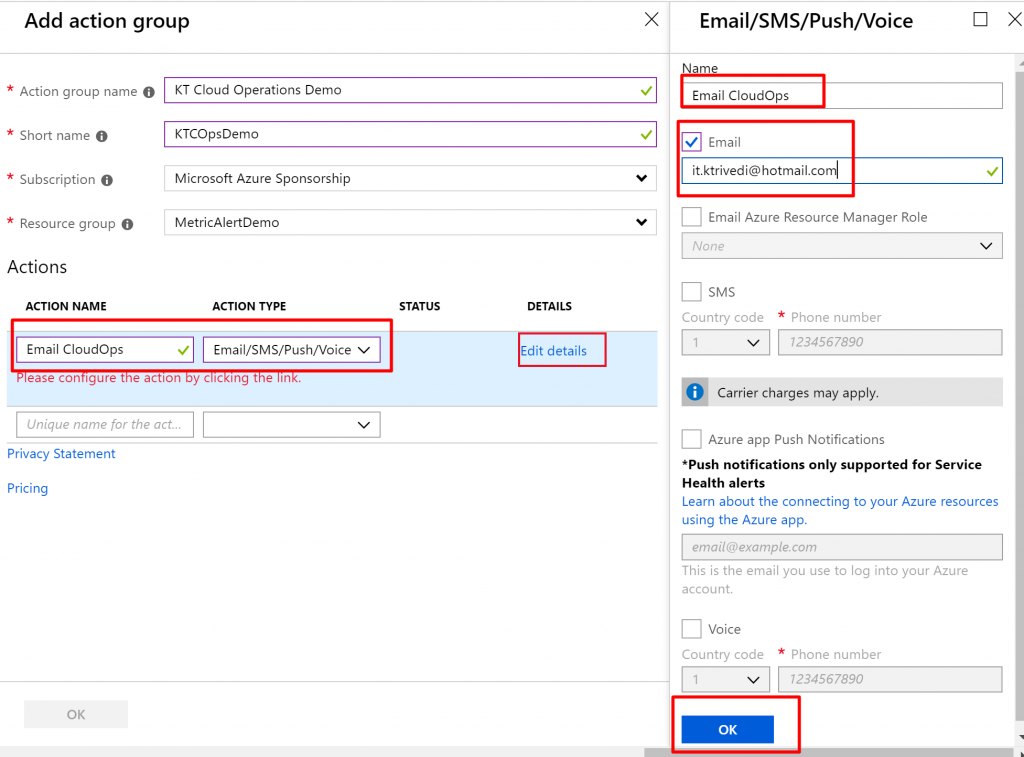
Step 14) In the actions section, give name to the action as Email CloudOps and select the action type as Email/SMS/Push/Voice. It will open up a new blade. Enter your valid Email ID to receive an email of the metric alert. Additionally, you can also provide phone details to receive an SMS alert. It is same for Push and Voice services as well. Click on OK.
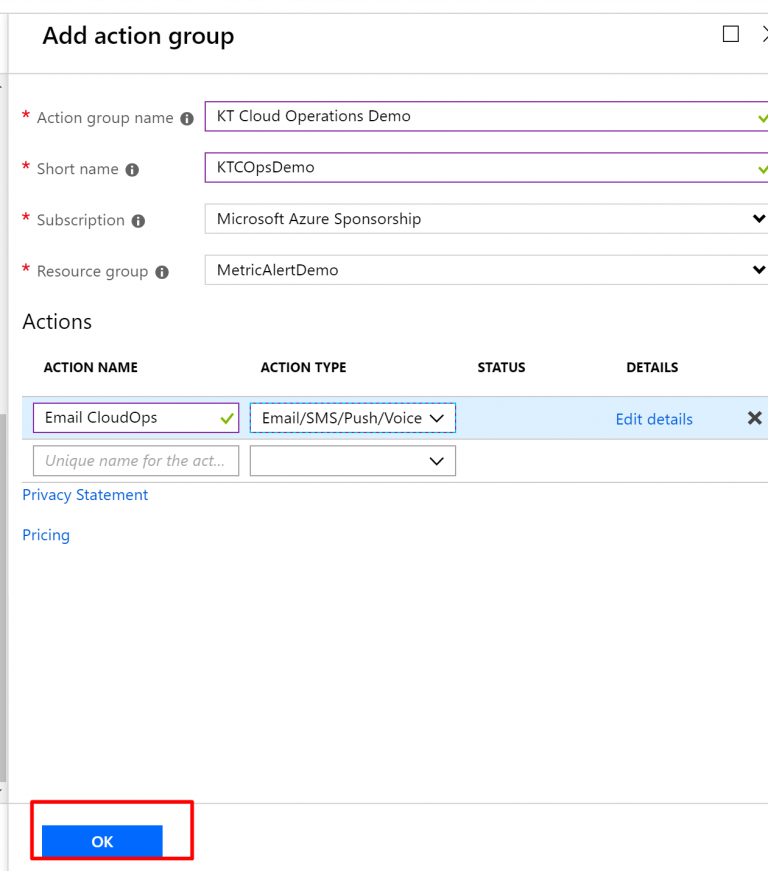
Step 15) Again click on OK.
Step 16) Once everything gets configured, you can review it and then click on create alert rule.
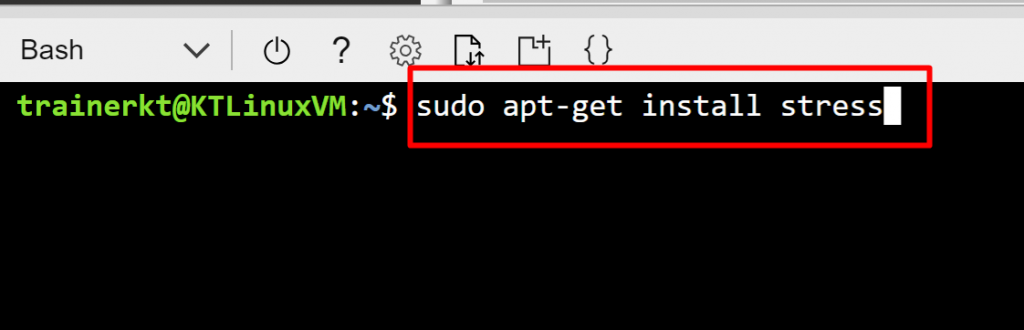
Step 17) Run the following command. The APT packet handling utility apt-get is used here to install stress, which is a tool used to stress test a Linux computer.
sudo apt-get install stress
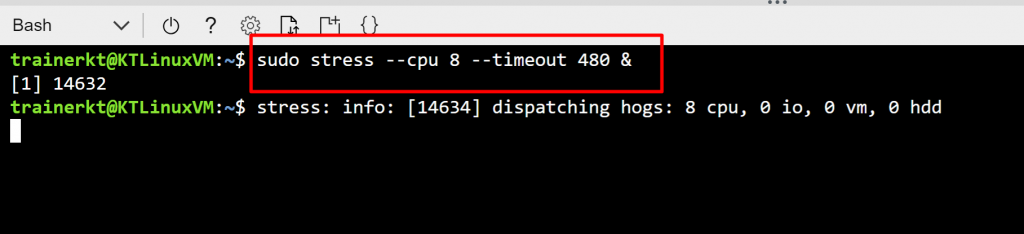
Step 18) Then run the following command. This command generates a CPU load on the virtual machine specifying 8 cpu hogs for a period of 480 seconds.
sudo stress --cpu 8 --timeout 480 &
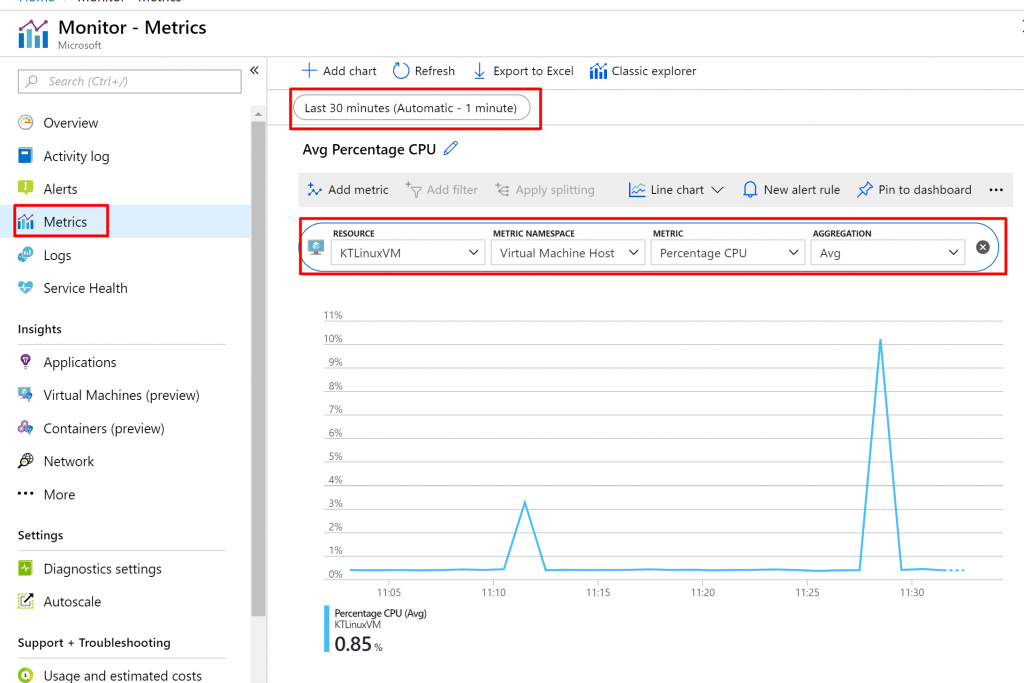
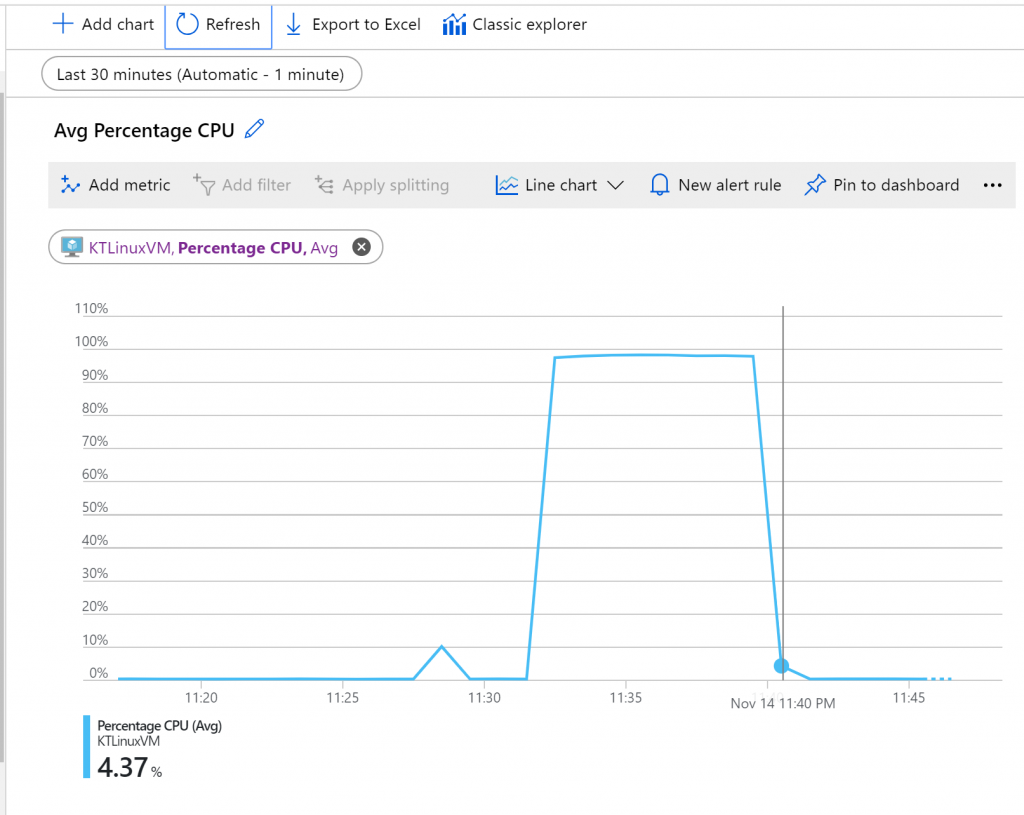
Step 19) While you are waiting for the email, go to the Metrics tab. Select a time range of Last 30 minutes, select KTLinuxVM as the resource, select Virtual Machine Host as the metric namespace, select Percentage CPU as the metric and Avg as the aggregation. Initially, it will show you a graph like the one shown below. Where you will see that the maximum CPU threshold would be around 10-15%.
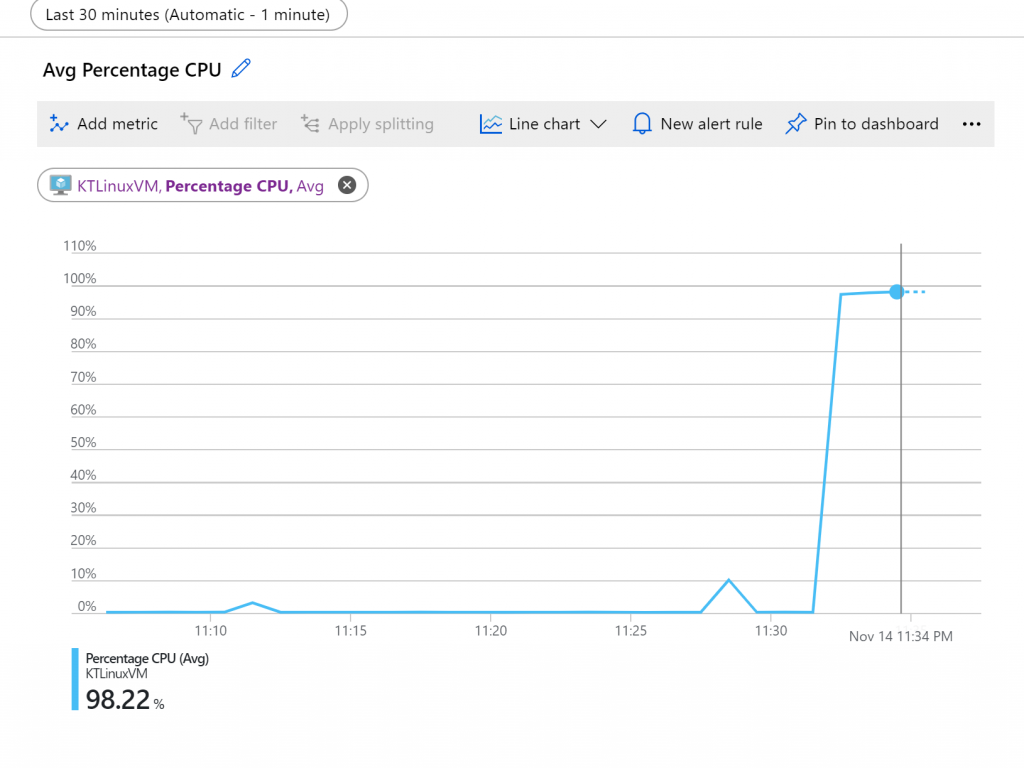
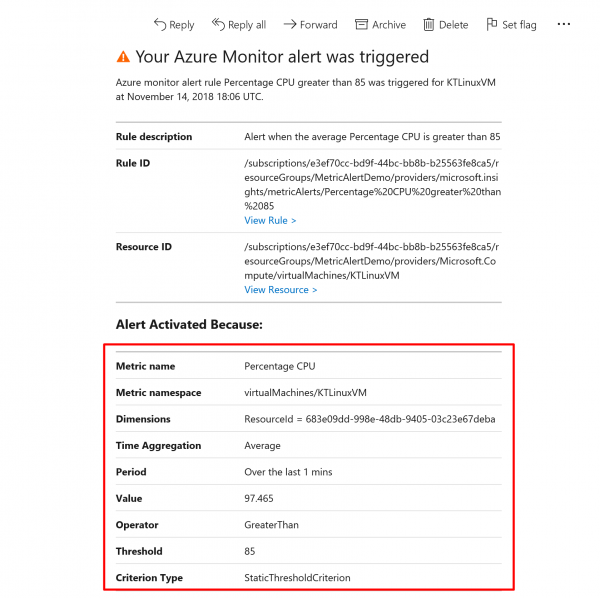
Step 20) However, after some time, you will see that the threshold would reach to a very high number. In my case it reached 98.22%. After some time, you will receive an email from Azure stating the metric alert.
Step 21) The email would be something like this stating that the Monitor Alert was triggered with all the important information.
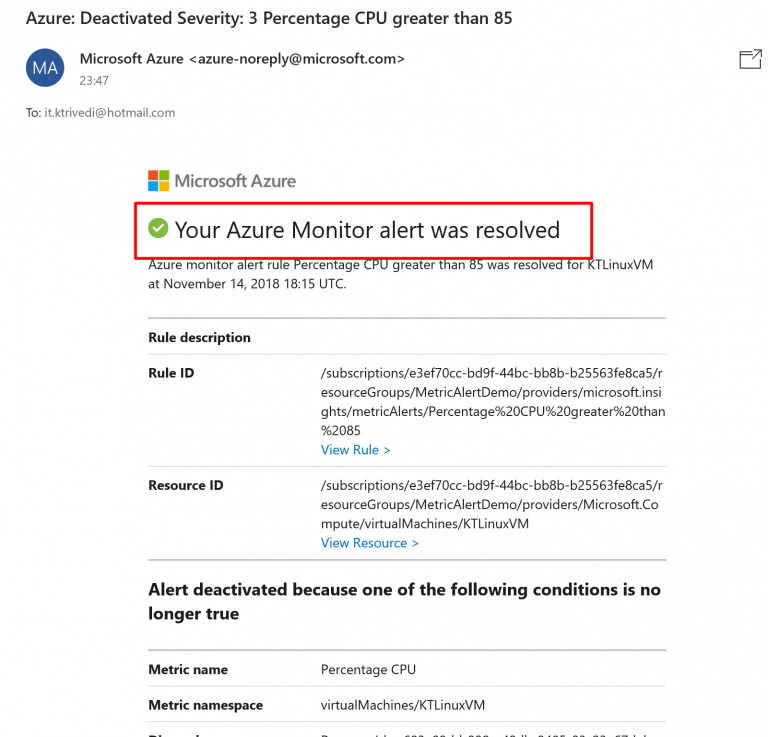
Step 22) After about 8 minutes, the threshold would be back to being low since we had run the stress test for 8 minutes.
Step 23) Then you will receive an email stating that the Monitor alert was resolved.
- So that’s it. In this demo, we created a Linux Virtual Machine. Then we created a virtual machine metric alert and then we tested a near real-time metric alert.